The aim of this experiment is to determine how the different variables affect resistance in different types of wires. There are several discussed factors that influence the amount of electric current transmitted from one point to another using the given wire. These factors are the cross sectional area of the wire, the length of the given wire, and the nature of the metal material. This experiment seeks to address the effect of the length of a wire in transmitting current. The following wires were selected to conduct the experiment: –
Electricity is transmitted by motion of electrons. These electrons tend to move randomly when excited at the point of power application. When power is supplied to the wire, a potential difference is created. The electrons drift from a region high concentration to that of low concentration. In so doing, current is transmitted and to ensure that there is unrestricted movement throughout the connection, atoms transfer electrical energy ans so when an electrical current conducts, one or two electrons shall possess sufficient energy to deviate away from the pull of the nucleus. This pull frees the electrons which are in a position to move randomly in a rapid motion. The electrons keep changing the direction of motion due to collision with other electrons that have been freed and the positive ions. These collisions cause resistance to the flow of current in the circuit. As a result, the width or thickness of a wire affects the amount of resistance in the flow of current within a circuit. Further restriction on the movement of current within the circuit may result in a lot of collision and increase the resistance. The thickness of the metal wire is a controllable independent variable within the experiment.
From figure 1, it can be inferred that the larger the cross sectional area of the conducting wire, the more the electrons can flow much freely. The reduced cross-sectional area results in a more compact electrons drift and greater resistance.
According to ohm’s law, when the potential difference is held constant, the current is inversely proportional to the resistance. This is denoted as shown below,
The formula above can be used to obtain the resistivity of the metal wires. The resistivity of a material is measured in ohm meter (?-m). The experiment conducts various tests to find out the ability of different metals to conduct electricity. For the experiment carried out, the tests ensure that the cross sectional area of the wires is constant throughout. The constant state is maintained even as the length of each wire is being altered.
H1: The experiment proposes that as the length of the metal wires is elongated, the current flow will be reduced as a result of increased resistance.
PROVE: The experiment further proves the hypothesis above by stating that the wire introduces more ion collisions for the duration that the wire is elongated. This in turn increases the resistance. There are more stationary ions for the negatively charged electrons to collide with because of the additional length. The resistance reduces for the electrons traveling over short wires as they encounter collisions for only a short period compared to the elongated wires.
Power supply
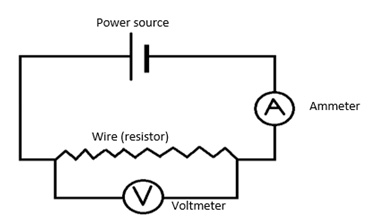
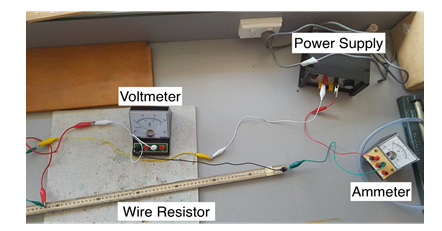
To avoid high voltages due to safety one is required to place a fireproof mat underneath the wire resistor to avoid potential wire burnout. This is a safety risk due to the thermal energy that heats up the wire to very high temperatures that could prompt the burnout. The difference in length are adjusted according to the wire malleability either to the positive or to the negative.
The following are the 5 test results obtained from the experiment when the length of the wire resistor was varied based on the length. The table shows the average resistances for each length per wire using gradients obtained by the line of best fit.
|
Average Resistance (ohms Ω) |
|||||
|
Wires (20swg) |
90cm |
80cm |
70cm |
60cm |
50cm |
|
Copper |
0.0312 |
0.0346 |
0.0235 |
0.0364 |
0.0206 |
|
Nichrome |
2.1692 |
1.7462 |
1.5461 |
1.4344 |
1.147 |
|
Constantan |
0.777 |
0.5908 |
0.5596 |
0.4823 |
0.3841 |
The following graph was plotted to show the relationship among the different materials used in the tests and their resistance as the lengths were increased. The graphs were plotted for the voltage against the current. Using ohm’s law, one can obtain the resistances. The “line of best fit” techniques are implemented to obtain a steady line for each material. The gradient of the resulting line shows the average resistance. The line of best fit is used rather than the exact averages as it eliminates the severity of the impact of anomalies and allows for trends to become more pronounced.
The difference in length for each wire used in the experiment was determined by its malleability and our ability to get it as straight as possible.
|
Copper wire |
+/- 1 cm |
|
Nichrome wire |
+/- 2cm |
|
Constantan Eureka Wire |
+/- 0.5 cm |
The graph is as displayed below
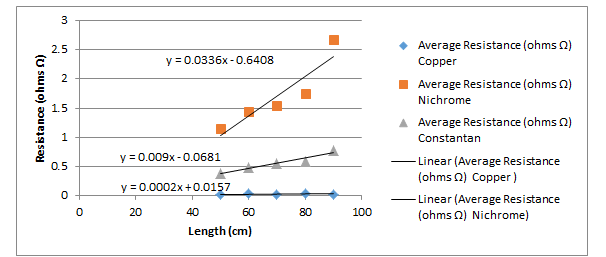
The results show trends and answers regarding the research question, however the experiment suffered from various aspects that were problematic. These complications were a common issue among the copper wire and reflect on the results it provided. The first issue was the power source, which would not give out the proper voltage and wouldn’t provide a constant current. We tried to adjust this by adding an adjustable resistor rheostat that did not work due to mechanical error. Another equipment issue was the alligator clips unable to attach to instruments securely. These caused the circuit to dropout often and/or give unstable results. Generated thermal heat energy was also another problem to the outcome due to its effect on the resistance of the wire. This is because of the increase of its temperature, causing the atoms to vibrate with more energy and therefore more vigorously, hence making the electrons flowing through the electric circuit more likely to collide with one of the atoms, so therefore increasing resistance. This is believed to be the main issue for the copper wire as it heated up extremely quick relating to its non-linear results with no clear trends or patterns.
Disregarding the copper wire the graph in figure 4, a trend is evidently displayed that as the length increases so does the resistance. This directly supports the hypothesis that was stated earlier. This demonstrates that at a reduced wire length it is for the current to flow though under less resistance and inverse for greater lengths.
To find the resistivity and/or conductivity of the wires use the formula R = ρL/A derived from the resistance formula R=V/I. Resistance ®, resistivity (ρ), cross- sectional area (A) and length (L). Manipulate formula so that:
The gradient (m) from y=mx+c is:
Derive formula to solve for ρ:
Where resistivity (ρ) 1/conductivity (σ)
Refer to Appendix 2 for correct graphs where length is in metres
Copper Wire
m= 0.0194 from Figure 5
ρ =0.0194 x 0.0006567
ρ = Ω m
Nichrome Wire
m = 2.3562 from figure 6
ρ =2.3562 x 0.0006567
ρ = Ω m
Constantan Eureka Wire
m= 0.8943 from Figure 7
ρ =0.8943 x 0.0006567
ρ =
The potential difference across a component and its resistance determines the current that passes through. This is presented as Potential Difference = Current x Resistance.
To ameliorate future recordings alterations can be made to the design and method of the experiment. Any heating effects of the current must be controlled and kept at a constant temperature. The wires can be firm and stretched out so that it is straight in turn reducing the number of bends and distortions to help give more precise wire measurements and final results.
In a nutshell, the hypothesis was confirmed to hold as demonstrated in the results and in the analysis section. The results show a trend confirming an increase in the resistance to the flow of current. The trend was evident in all the materials used in the experiment as shown in the graphical illustration under the results and observation section. The ohm’s law holds and is used to determine the relationship between the length of a wire and its resistivity.
https://www.qcaa.qld.edu.au/downloads/senior/snr_physics_07_eei_electricity.pdf
https://www.markedbyteachers.com/gcse/science/resistance-in-a-wire-13.html
Delivering a high-quality product at a reasonable price is not enough anymore.
That’s why we have developed 5 beneficial guarantees that will make your experience with our service enjoyable, easy, and safe.
You have to be 100% sure of the quality of your product to give a money-back guarantee. This describes us perfectly. Make sure that this guarantee is totally transparent.
Read moreEach paper is composed from scratch, according to your instructions. It is then checked by our plagiarism-detection software. There is no gap where plagiarism could squeeze in.
Read moreThanks to our free revisions, there is no way for you to be unsatisfied. We will work on your paper until you are completely happy with the result.
Read moreYour email is safe, as we store it according to international data protection rules. Your bank details are secure, as we use only reliable payment systems.
Read moreBy sending us your money, you buy the service we provide. Check out our terms and conditions if you prefer business talks to be laid out in official language.
Read more