The report comprises of three parts. The first one describes the business process modelling of the company BalognePty. Ltd. The second part includes how the web 2.0 will effective for the communication of internal and external processes of the company (Andriole 2012). The third part have sales data analysis from using excel and net profit index of the years 2014 and 2015.
A business process modelling is a series of activities in a diagram connected through lines. A flow chart of activities that an organisation goes through to achieve the product that are sold in the market. It is essential for higher-level organisations and has continuous improvement of their operational activities (Tredinnick 2013). It includes both Information technology process and people process. The flow chart includes the resources and activities that are there for combining the work. The bigger the organisation the more scalability and complex the operations and the process involved. The purpose of this flow diagram is to materialise the outcome of the performance parameters and focus improvement. Increase value added actions for the customer and reduce cost for the company. It also makes divisions of activity and makes distinct responsibility points.
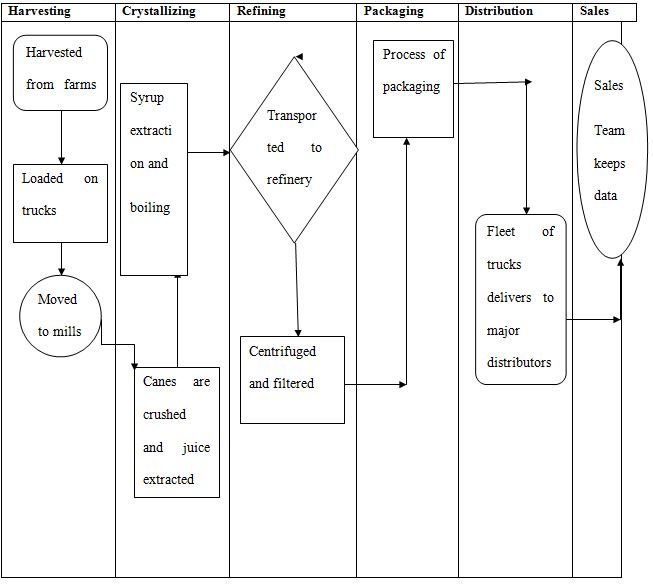
The process model of the activities of Balogne makes distinct process that the company goes through and different departments that are there to handle different responsibility (Chen, Chiang and Storey 2012). The general manager can view the different department and the activities that are there in the process flow diagram in part B. The five different departments consolidate the process the company goes through to make consumable sugar. It is helpful in decision making with the help of the sales data and analysis part. It also helps in identifying redundancies, gap and if there is any duplication of process.
The software tool is helpful for analysis and drawing conclusion from the sales data that are collected from the business tool. The functioning (fx) in Microsoft excel is rather easy to use for calculation and if the data and its observations are huge in number one can easily draw conclusion.
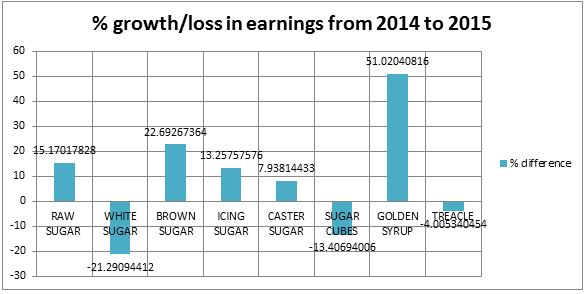
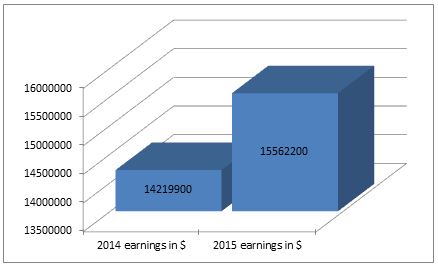
The values got using the functions of Microsoft excel are given in the spreadsheet. The golden syrup component of sugar is the most profit making and the percentage of growth from 2014 to 2015 is the highest near about 51% of growth in earning as well as profit. The ascending order of growth is brown sugar > raw sugar > icing > caster are accordingly in making growth in earning. The loss making components of sugar are in ascending order white sugar > sugar cubes > treacle. Graph 2 suggests the difference in the earnings in 2014 and 2015. This gives the insight that the company is growing by years and their earnings are growing. The difference in earnings in dollars is $13, 42,300. The investment decisions can be made by this information and where the sale is increasing and where the products are making loss and what are the future steps that can be taken for recovery from loss can be identified from the excel sheet. The outlook of the % growth or loss in difference is given in the V-lookup function and the intensity of growth and loss can also be calculated.
Web2.0 is worldwide websites that are used for better communication among the organisations and the companies that use this have really benefited from this.69% of users of web 2.0 has benefited from this new technology. This enable the company by introducing more innovative products, marketing that is more effective, idea sharing, improved communication, better access of knowledge, lower cost of doing business, higher revenues(Jussila, Kärkkäinen and Aramo-Immonen 2014). This also enhances the cultural benefit of the organisation and better networking of internal and external stakeholders’ (Venkatesh Croteau and Rabah 2014). The integration of the whole organisation process can also be benefited as that may include the whole Enterprise resource planning affective (Sigala 2012). The features that make it unique are
The two different types of application that will be useful for the Balogne are
Assumptions
The swim lane diagram of the process flow is the consolidation of beginning point, activities, decision, and terminal point. The swim lane diagram the beginning point is the harvesting of the sugar cane from farmers, which is given in the shape of rounded rectangle (O’reilly 2012). The end-point is collection of data for the sales team of BalognePty Ltd. The activities or the functions that undergoes for this manufacturer are
As per the values in the excel sheet the 2014 earnings comes to $1,42,19,900 and 2015 earnings comes to $1,55,62,200. Therefore, the total increase in dollars are ($1,55,62,200 – $1,42,19,900) = $13,42,300
That suggests the percentage of growth or loss in two years in 8 categories of sugar is below.
Suggests the yearly earnings and difference in earnings between 2 years 2014 and 2015 in dollars.
|
product description |
net profit of 2014 |
net profit 2015 |
|
RAW SUGAR |
3085000 |
3553000 |
|
WHITE SUGAR |
2595000 |
2042500 |
|
BROWN SUGAR |
5255000 |
6447500 |
|
ICING SUGAR |
528000 |
598000 |
|
CASTER SUGAR |
1358000 |
1465800 |
|
SUGAR CUBES |
380400 |
329400 |
|
GOLDEN SYRUP |
269500 |
407000 |
|
TREACLE |
749000 |
719000 |
|
TOTALS |
14219900 |
15562200 |
Therefore, from the above table we can conclude that the profit for raw, brown and icing sugar are more profitable in both the years.
It can be concluded from the above report that the company is in growth in terms of sales and earnings. Further, they can integrate the web 2.0 technology for more effectiveness in communication. The report is useful to interpret with the help of excel sheet.
Andriole, S.J., 2012. Business impact of Web 2.0 technologies. Communications of the ACM, 53(12), pp.67-79.
Tredinnick, L., 2013. Web 2.0 and Business: A pointer to the intranets of the future?. Business information review, 23(4), pp.228-234.
O’reilly, T., 2012. What is web 2.0.
Kim, H.D., Lee, I. and Lee, C.K., 2013. Building Web 2.0 enterprises: A study of small and medium enterprises in the United States. International Small Business Journal, 31(2), pp.156-174.
Jussila, J.J., Kärkkäinen, H. and Aramo-Immonen, H., 2014. Social media utilization in business-to-business relationships of technology industry firms. Computers in Human Behavior, 30, pp.606-613.
Laudon, K.C. and Traver, C.G., 2013. E-commerce. Pearson.
Chen, H., Chiang, R.H. and Storey, V.C., 2012. Business intelligence and analytics: From big data to big impact. MIS quarterly, 36(4).
Tucker, S.Y., 2014. Transforming Pedagogies: Integrating 21st Century Skills and Web 2.0 Technology. Turkish Online Journal of Distance Education, 15(1), pp.166-173.
Venkatesh, V., Croteau, A.M. and Rabah, J., 2014, January. Perceptions of effectiveness of instructional uses of technology in higher education in an era of Web 2.0. In System Sciences (HICSS), 2014 47th Hawaii International Conference on (pp. 110-119). IEEE.
Sigala, M., 2012. Exploiting Web 2.0 for new service development: findings and implications from the Greek tourism industry. International Journal of Tourism Research, 14(6), pp.551-566.
Delivering a high-quality product at a reasonable price is not enough anymore.
That’s why we have developed 5 beneficial guarantees that will make your experience with our service enjoyable, easy, and safe.
You have to be 100% sure of the quality of your product to give a money-back guarantee. This describes us perfectly. Make sure that this guarantee is totally transparent.
Read moreEach paper is composed from scratch, according to your instructions. It is then checked by our plagiarism-detection software. There is no gap where plagiarism could squeeze in.
Read moreThanks to our free revisions, there is no way for you to be unsatisfied. We will work on your paper until you are completely happy with the result.
Read moreYour email is safe, as we store it according to international data protection rules. Your bank details are secure, as we use only reliable payment systems.
Read moreBy sending us your money, you buy the service we provide. Check out our terms and conditions if you prefer business talks to be laid out in official language.
Read more